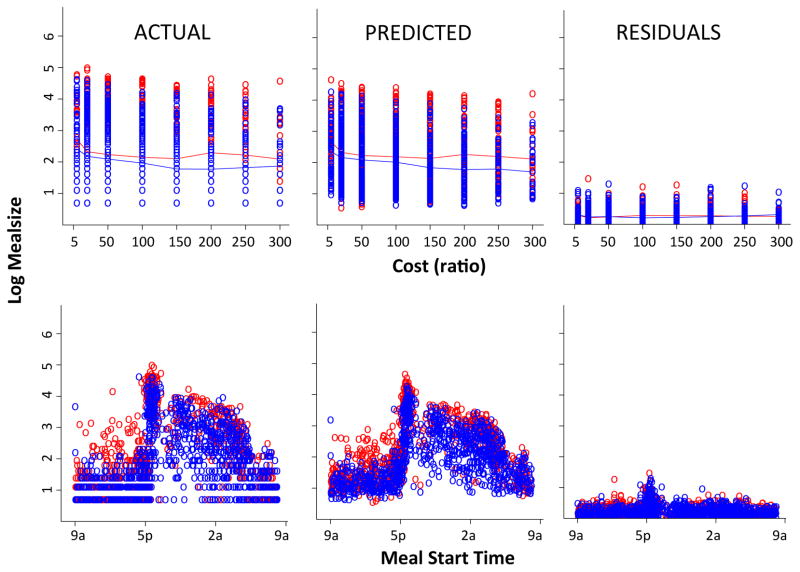
Figure 7.
Performance of meal termination (meal size) model. Actual data, predicted values and residuals presented left to right. Each point represents a meal within the entire dataset (all subjects, all days). Top row plotted by cost, bottom row plotted by meal start time. Wild-type (red) and DATkd (blue). N = 8.

