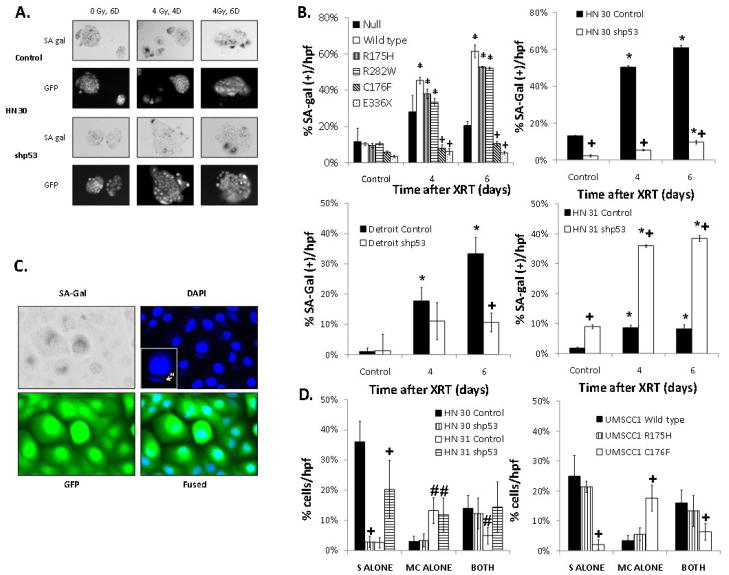
Figure 3. TP53 modulates radiation-induced senescence, which correlates with radiosensitivity.
(A) Representative light microscopy showing SA-Gal staining. (B) Percentage of SA-Gal positive cells per total number of cells in a high power field after 4 Gy of radiation for the times indicated in UMSCC1 cells expressing representative wild type and mutant TP53 constructs and HN 30 (WT), Detroit (R175H) and HN 31 (C176F) where p53 is inhibited. (C) Representative microscopy showing SA-Gal staining, DAPI fluorescence, and GFP. (D) Percentage of cells either SA-Gal positive (S alone), exhibiting micronuclei (M alone) or both at 4 days after 4 Gy of radiation in HN 30 and HN 31 cells where p53 expression is inhibited and UMSCC1 cells expressing representative wild type and mutant TP53 constructs. * - significantly elevated over baseline (p<0.05), + - significantly different from null at the indicated time point (p<0.05), # - significantly different from HN 30 control.

