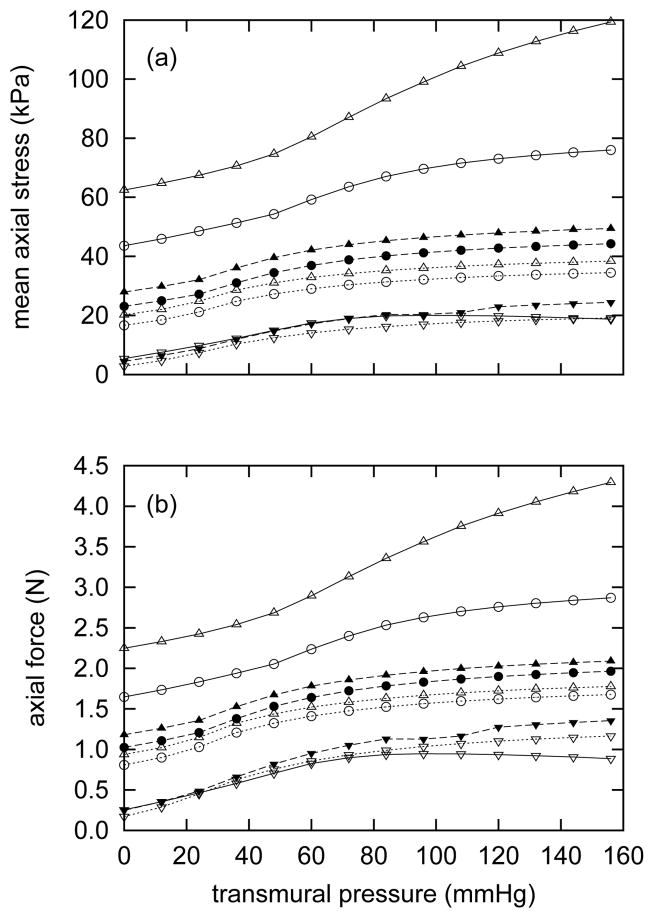
Figure 12.
Evolving passive axial stress (panel a) and axial force (panel b) as functions of transmural pressure. Curves represent responses at axial stretches of λ = 1.05 (triangles), λ = 1.0 (circles) and λ = 0.8 (inverted triangles) at actual ages of 20 years (open symbols with solid lines) 50 years (filled symbols with dashed lines), and 60 years (open symbols with dotted lines). All results for βc = 0.2. Note the generally decreasing trends for both mean axial stress and retraction force, consistent with the increased arterial thicknesses (figure 7) and unloaded lengths (figure 9, panel a).

