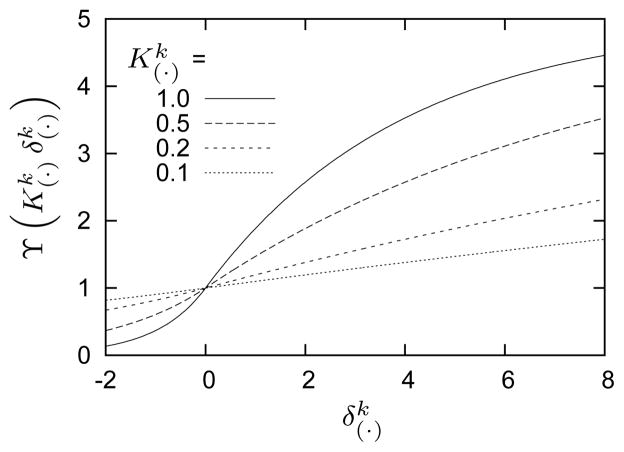
Figure 3.
Functional relationship between normalized mass production rate and a change in mechanical stimulus for indicated values of and where (cf., equation (25)). The sigmoidal behavior approximates observed saturation limits for mass production rates as functions of shear-induced changes in NO or ET-128,72,73. Also note the nearly linear behavior near , retaining features of previously implemented models105.

