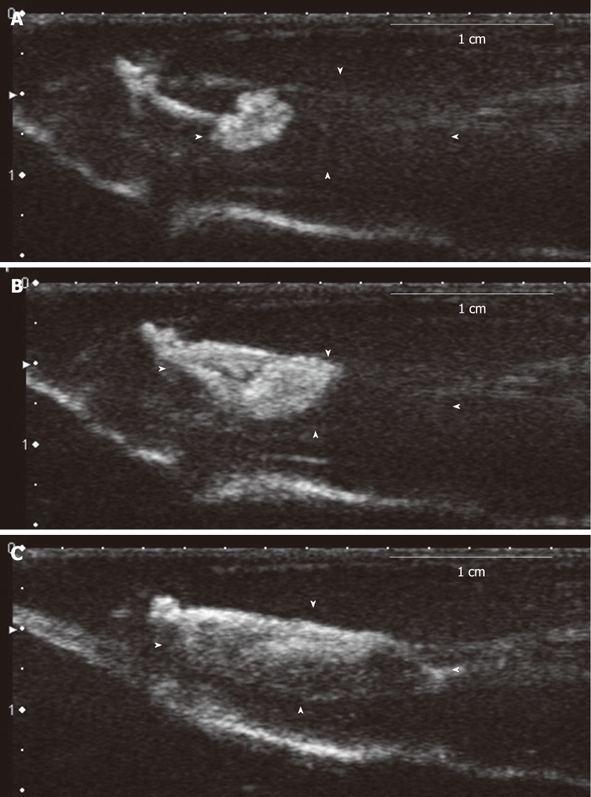
Figure 2.

Lymph node imaging (dynamics study). The model of inflammation-induced lymph node enlargement at 3 d after Escherichia coli was implanted (model 8). A: The image of the lymph hilum 9 s later, showing flow of the contrast agent from the afferent lymph duct; B: The contrast agent reached the center of the lymph node from the lymph hilum 12 s later; C: The entire lymph node was imaged 15 s.
