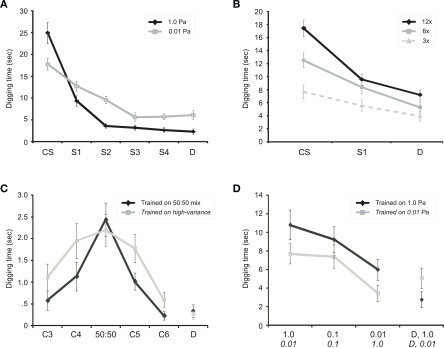
Figure 3.
Olfactory generalization gradients in mice. (A) Associative generalization from a conditioned odorant stimulus (CS) to a series of four sequentially similar odorants (S1-S4) plus one structurally and perceptually dissimilar control odorant (D). Presenting all odorants at a higher concentration (theoretical vapor-phase partial pressure of 1.0 Pa; black line) yielded a steeper, narrower generalization gradient than did identical training with low-concentration odorants (0.01 Pa; gray line), reflecting the learning-theoretic principle that higher CS salience supports greater learning. Twelve training trials were administered prior to testing. Figure adapted from Cleland et al., (2009). (B) Increasing the number of training trials (CS-reward pairings) prior to testing progressively increased perseverance and sharpened associative generalization gradients. 3×: three training trials; 6×: six training trials; 12×: 12 training trials. Figure adapted from Cleland et al., (2009). (C) Generalization gradients adapt to the variance of the conditioning odor. The high-variance conditioning group (see Methods) generalized fully across the range of CS variability (no difference in digging times between 50:50 and either C4 or C5; Welch test, t(46.36) = 0.444, p = 0.659; t(47.43) = 0.854, p = 0.398, respectively), whereas the low-variance group clearly distinguished both C4 and C5 from the 50:50 odor mixture CS (significant differences in digging times; Welch test, t(56.87) = 2.583, p = 0.012; t(43.45) = 3.314, p = 0.002, respectively). (D) Mice perceive sufficiently different concentrations of novel odorants as distinct odors. One group of mice was conditioned to an odorant CS at a high concentration (1.0 Pa; black line, test concentrations in Pa listed in Roman font on x-axis) and tested on two lower concentrations of that odorant as well as a dissimilar control odorant (D) at 1.0 Pa. A second group was conditioned to the same odorant CS at a low concentration (0.01 Pa; gray line, test concentrations in Pa listed in italic font on x-axis) and tested on two higher concentrations of that odorant as well as a dissimilar control odorant (D) at 0.01 Pa. Both groups treated the test odorant that was two orders of magnitude higher or lower in concentration as a distinct odor, roughly comparable in similarity to a structurally dissimilar odorant D. See the Learning-Dependent Construction of Odor Representations section for analysis details. Odor sets and vol/vol dilutions are detailed in Table 1. In all figures, error bars denote the standard error of the mean.

