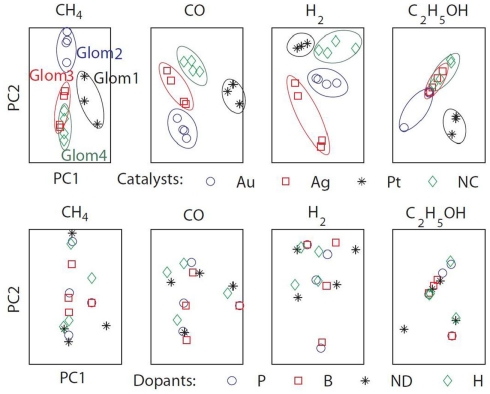
Figure 9.
The sensors’ responses to target gases (methane, hydrogen, ethanol, and carbon monoxide) were projected onto two-dimensional spaces by using PCA. The first two eigenvectors accounted for more than 99% of the variance. Top: grouping the sensors according to their catalysts revealed four identifiable clusters mimicking the formation of biological glomeruli (Glom1, 2, 3, and 4). Bottom: grouping the sensors according to their dopants did not reveal any particular clustering.

