
Figure 1.
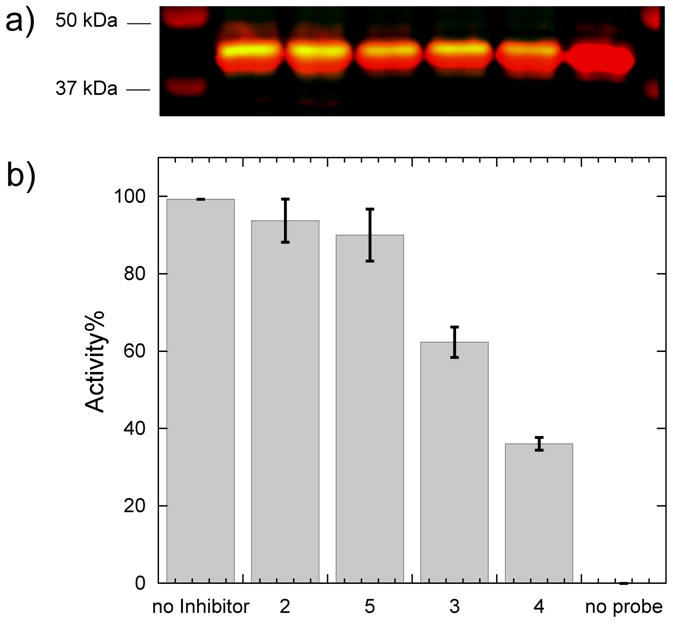
Ranking of 2 – 5 for potency of DDAH-1 inhibition in cells. a) Two-color Western blot reflecting the presence of myc (red) and biotin (green) tags after labeling of overexpressed human DDAH-1 in HEK 293T cells in the presence of inhibitors (350 μM each). Left from right: molecular weight markers, no-inhibitor control, 2, 5, 3, 4, no-probe control. b) Fluorescence intensities for the biotin-derived signal are calculated for every inhibitor and converted to Activity (%) by normalizing each intensity to the no-inhibitor control as 100 % and no probe (6) as 0 %. Data are the mean ± standard error for replicate experiments (n > 3).