Figure 7.
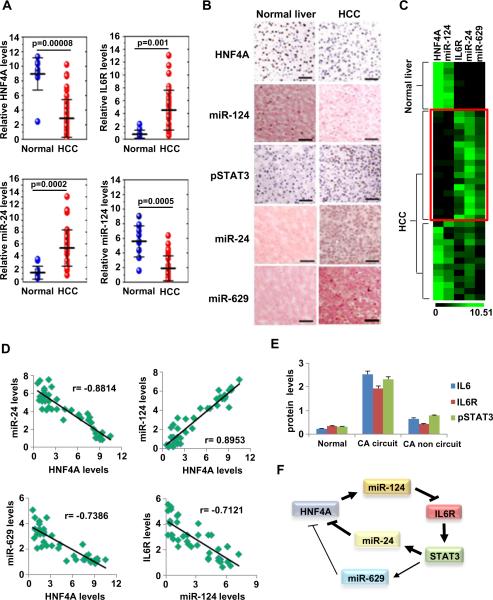
HNF4α circuit is perturbed in human hepatocellular carcinomas. (A) Assessment of HNF4α, IL6R, miR-24 and miR-124 levels (mean ± SD) by real-time PCR analysis in total RNAs derived from 12 normal liver tissues and 45 hepatocellular carcinomas. (B) Immunohistochemistry for HNF4α, pSTAT3 and in situ hybridization for miR-124 and miR-24 in FFPE sections of hepatocellular carcinomas and normal liver tissues. Sections were subjected to immunohistochemistry for HNF4α (DAB staining, brown color) and phospho-STAT3 (Tyr705) (DAB staining) and counterstained with haematoxylin (blue color) and in situ hybridization for miR-124, miR-24, and miR-629 and counterstained with nuclear fast red. Bar, 100 μm. (C) Heatmap representation of HNF4α, IL6R, miR-24 and miR-124 levels assessed by real-time PCR (mean ± SD) in tissue-microdissected FFPE sections of 8 normal liver tissues and 31 hepatocellular carcinomas. (D) Correlation between the expression levels of different members of the HNF4α circuit (same samples as in figure 7C). Each data point represents an individual liver tissue sample and a correlation coefficient (r) is shown. (E) Levels of IL6, IL6R and pSTAT3 (Tyr705) assessed by ELISA, in 8 normal liver tissues, 31 hepatocellular carcinomas [18 tissues with activation of the HNF4α circuit (CA circuit) and 13 liver cancer tissues without activation of the HNF4α circuit (CA non circuit)]. The data are presented as mean ± SD of three independent experiments. (F) Schematic representation of the proposed HNF4α feedback circuit in hepatocellular oncogenesis.

