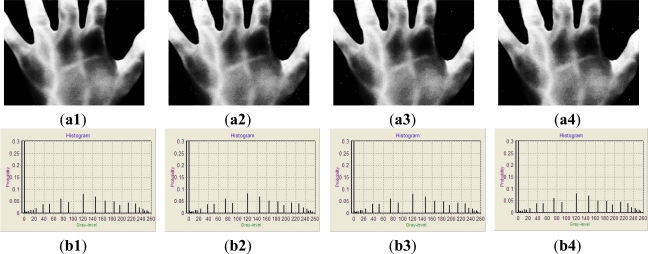
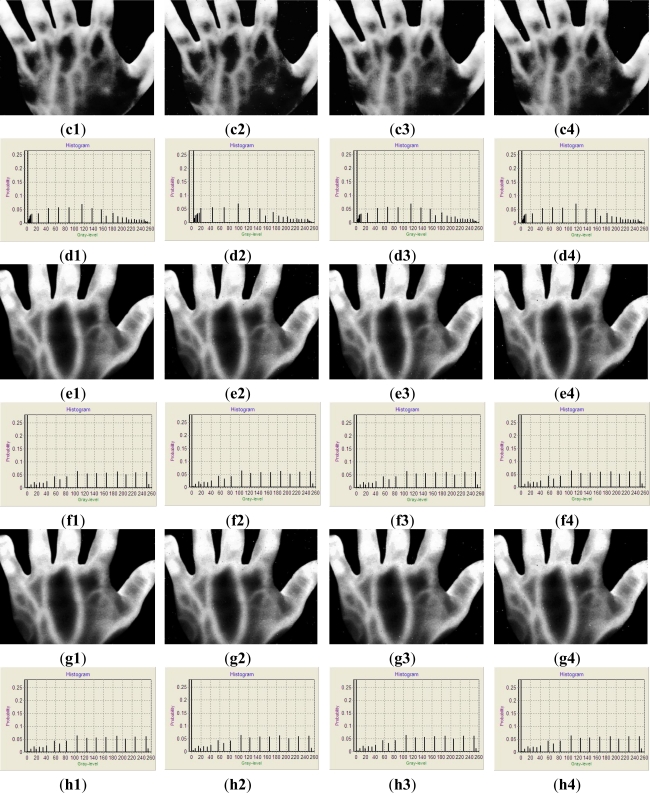
Figure 5.
The results enhanced by HCHE. (a1–a4) show the results of Figure 3(b1–b4) enhanced by HCHE, respectively; (b1–b4) show the histograms of (a1–a4), respectively; (c1–c4) show the results of Figure 3(d1–d4) enhanced by HCHE, respectively; (d1–d4) show the histograms of (c1–c4), respectively; (e1–e4) show the results of Figure 3(f1–f4) enhanced by HCHE, respectively; (f1–f4) show the histograms of (e1–e4), respectively; (g1–g4) show the results of Figure 3(h1–h4) enhanced by HCHE, respectively; (h1–h4) show the histograms of (g1–g4), respectively.


