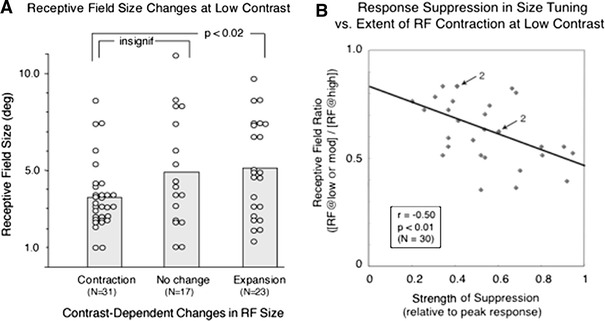
Fig. 4.

Physiological correlates. a Relation between the RF size and its changes at low contrast, based on 71 data points derived from 48 cells (same cells that appear in Fig. 3). The average RF size determined by the peak or asymptote in the standard size tuning curves turned out to be significantly smaller in the 31 contracting cells (3.6 ± 1.7 deg) than that of the 23 expanding cells (5.1 ± 2.5 deg) at p < 0.02. But, the difference between the contracting cells and 17 no change cells (4.9 ± 2.9 deg) did not reach a significant level. b The extent of RF contraction at low or moderate contrast is related to the strength of response suppression in RF size tuning. The scatter diagram shows the distribution of 30 RF size ratios in the contracted cells (contraction index as calculated above). See Fig. 3 legend on the ordinate plotted against respective values of response suppression relative to the peak response in standard size tuning curves. The RF size ratios are significantly related to the strength of response suppression measured in standard size tuning tests with regression coefficient r = −0.50 at p < 0.01 (Student t test). The number 2 with the arrow indicates two points overlapping
