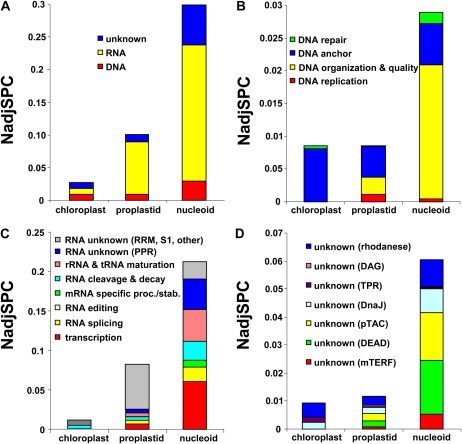
Figure 3.
Comparison of protein investments of chloroplasts, proplastids, and nucleoids for the proteins listed in Table I. A, Relative abundance of the proteins in the three main functions as in Table I, namely DNA ([putative] DNA-related functions: DNA replication, DNA organization and quality control, anchoring, and DNA repair), RNA (putative RNA-related functions: transcription, RNA splicing, editing, cleavage, stability, rRNA and tRNA maturation, and other predicted RNA-binding proteins with unknown functions), and Unknown (proteins with unknown functions with TPR, mTERF, DEAD, rhodanese, or DnaJ domains or pTAC proteins with unknown functions). B, Relative mass distribution of proteins within the function DNA. C, Relative abundance of proteins within the function RNA. D, Relative abundance of proteins within the function Unknown. Details are provided in Table I.

