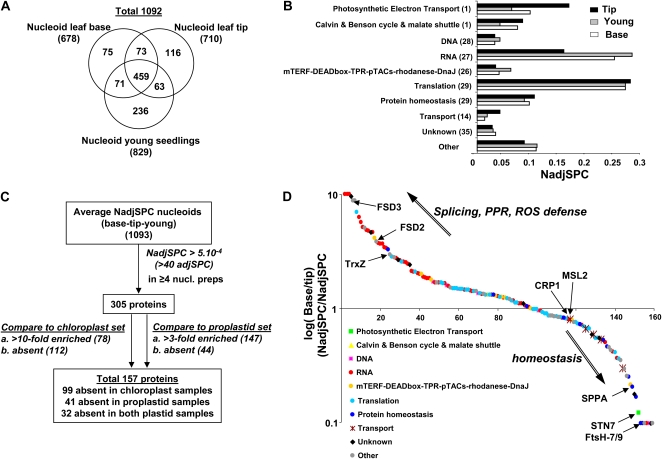
Figure 5.
Comparison between nucleoid preparations isolated from the leaf base, tip, or young seedlings. A, Venn diagram showing the overlap between the identified nucleoid proteomes; in total, 1,092 proteins were identified. B, Comparison of protein abundance (based on NadjSPC) of the 10 different functional groups defined as for Figure 2B. C, Work flow for determination of the nucleoid core proteome. D, Base-tip ratio plot for the 157 proteins defined in the work flow in C. Data points are color coded based on the 10 functions defined for Figure 2. Identities of a few proteins are indicated. Details for all 157 proteins are provided in Supplemental Table S5.

