Figure 4.
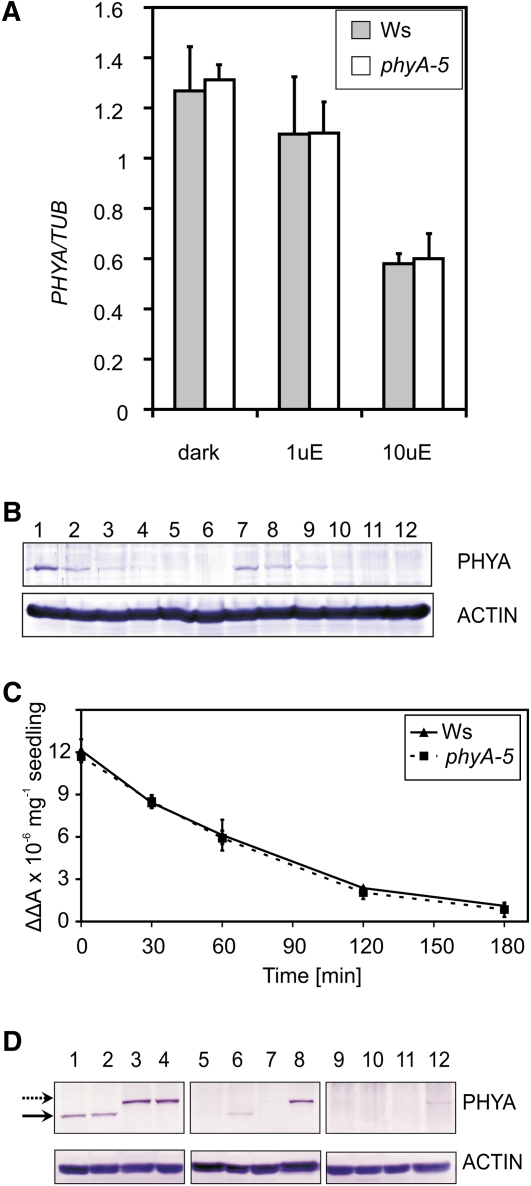
PHYA mRNA and protein levels in phyA-5 and wild-type seedlings. A, Ws and phyA-5 seedlings were grown in darkness (dark), 1 μmol m−2 s−1 (1uE), or 10 μmol m−2 s−1 (10uE) FR light for 4 d. After performing RNA extraction, PHYA mRNA levels were determined by qRT-PCR. Data normalized to TUBULIN2/3 levels are shown. Error bars indicate se. B, Four-day-old Ws (lanes 1–6) or phyA-5 (lanes 7–12) etiolated seedlings irradiated with 25 μmol m−2 s−1 R light were subjected to total protein isolation and western-blot analysis using PHYA (top panel) or ACTIN-specific (bottom panel) antiserum. The lengths of the R light treatments were 0 h (lanes 1 and 7), 1 h (lanes 2 and 8), 2 h (lanes 3 and 9), 3 h (lanes 4 and 10), 4 h (lanes 5 and 11), and 6 h (lanes 6 and 12). C, Four-day-old etiolated seedlings were irradiated with continuous R light (25 μmol m−2 s−1). The amount of total phytochrome was measured by in vivo spectrophotometry. Error bars indicate se. D, Seedlings were grown for 4 d in darkness (lanes 1–4), 1 μmol m−2 s−1 (lanes 5–8), and 10 μmol m−2 s−1 (lanes 9–12) FR light and were subjected to total protein isolation and subsequent western-blot analysis using PHYA (top panels) or ACTIN-specific (bottom panels) antiserum. The examined genotypes are as follows: Ws (lanes 1, 5, and 9); phyA-5 (lanes 2, 6, and 10); PHYA:PHYA-YFP in phyA-201 (lanes 3, 7, and 11); and PHYA:PHYA-5-YFP in phyA-201 (lanes 4, 8, and 12). The solid arrow marks the bands corresponding to endogenous PHYA, whereas the dashed arrow marks the PHYA-YFP-specific bands. [See online article for color version of this figure.]

