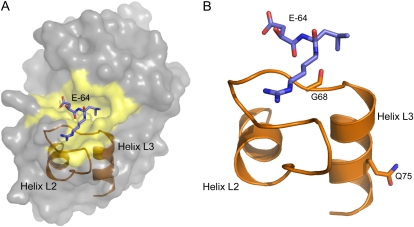
Figure 4.
ACT1A-2 protein modeling. A, A representation of the ACT1A-2 protein structure based on the ACT1A-1 crystal structure (Varughese et al., 1992). The E-64 inhibitor (purple), active site region (yellow), and the L2 and L3 helices, which help to form part of its topology, are also indicated. B, The positioning of the active-site Gly (G68) and more distal Gln (Q75) residues implicated in ACT1A-2 activity. Helices are named according to the nomenclature of Kamphuis et al. (1984), and the E-64 inhibitor is positioned according to that in the ACT1A-1 crystal structure (Protein Data Bank code 1AEC).

