Figure 5.
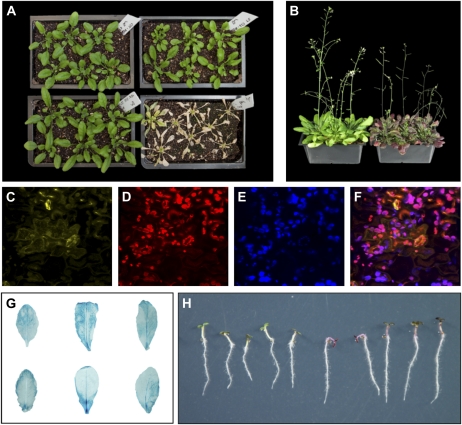
Phenotypic analysis of nine-transgene-long transgenic Arabidopsis plants. A, Basta resistance in three independent transgenic lines. Clockwise from bottom left: offspring of T0 L10 plants, offspring of T1 L6-1 plants, offspring of T1 L7 plants, and wild-type plants. B, PAP1 phenotype in offspring of T2 L3-3-1 plants (right). Wild-type plants are shown on the left. C to F, EYFP-CHS expression (in yellow), ChrD-RFP and DsRed2-P expression (in red), plastid autofluorescence (in blue), and merged signals in leaf of T1 L6-1 plants. All panels are single confocal sections. G, Heat shock-induced GUS expression in transgenic leaves. Clockwise from top left: samples from L2-1-1, L2-2-1, L6-1-1, L10-2-1, L10-1-1, and L6-2-2. H, PAP1 phenotype in seedlings of offspring of T2 L6-2-2 plants (left). Seedlings of wild-type plants are shown on the right.

