Figure 1.
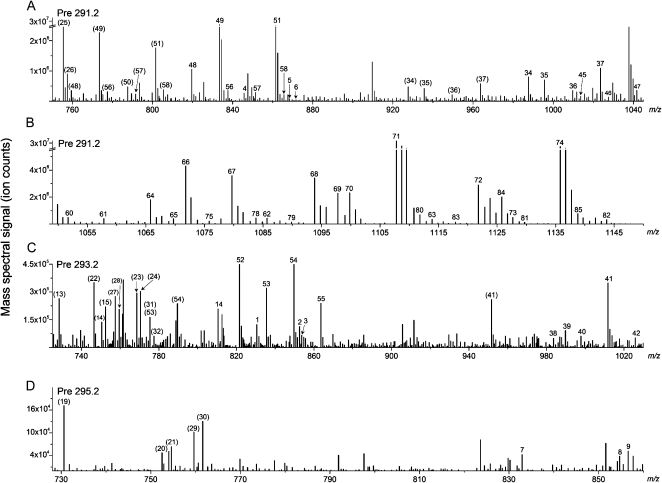
ESI triple quadrupole MS precursor ion spectra acquired on extracts of leaves of Arabidopsis plants infected with PstAvr for 24 h. A and B, Pre 291.2. C, Pre 293.2. D, Pre 295.2. Pre 291.2 scan detects ox-lipids containing 18:4-O and 18:3-2O, Pre 293.2 scan detects ox-lipids containing 18:3-O and 18:2-2O, and Pre 295.2 scan detects ox-lipids containing 18:2-O. Peaks with labels in parentheses are [M − H]− adducts. Peak labels with no parentheses indicate [M + C2H3O2]− adducts. Note that the intensity and m/z scales of the spectra differ. A and B have breaks in the intensity axes. Details of peaks numbered 1 to 86 are shown in Table II.

