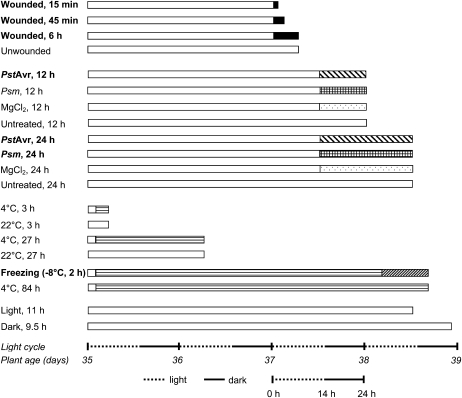
Figure 2.
Treatments of 5-week-old wild-type Arabidopsis plants. Each bar represents five plants under a single treatment, except that in the freezing treatment the plants were cold acclimated (horizontally striped bar) at 4°C before being gradually frozen (diagonally hatched bar); see “Materials and Methods.” For each treatment, the white bar at the left indicates normal growth conditions, while patterned bars to the right indicate the stress conditions. The far right end of each bar indicates the harvest point. The last two samples were controls intended to identify any effects due to time of day at harvest. Total ox-lipid signals for all samples are shown in Figure 3. Detailed lipid profiles of the samples indicated in boldface are shown in Figure 4. Detailed profiles of the other samples are shown in Supplemental Figure S3.

