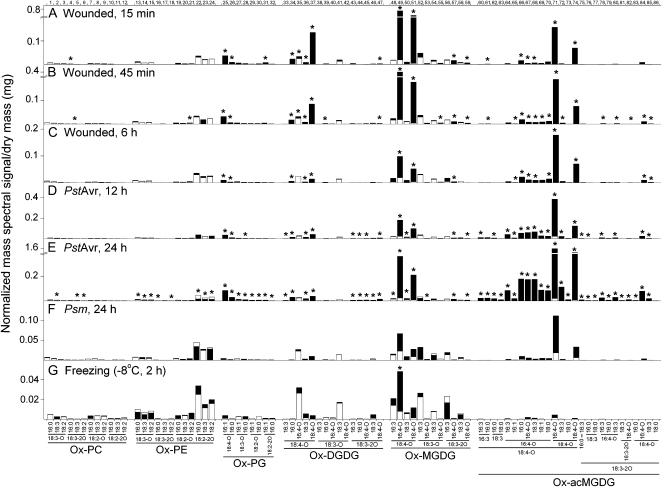
Figure 4.
Oxidized membrane lipids under stress conditions as quantified by triple quadrupole MS precursor scanning. A, Wounded, 15 min. B, Wounded, 45 min. C, Wounded, 6 h. D, PstAvr, 12 h. E, PstAvr, 24 h. F, Psm, 24 h. G, Freezing (−8°C, 2 h). Numbers along the top x axis refer to peaks/compounds in Table II. In each panel, the white bars denote the basal amount as determined under the corresponding control condition: unwounded, for A, B, and C; MgCl2, 12 h, for D; MgCl2, 24 h, for E and F; and 4°C, 84 h, for G. The black bars denote the amount of each ox-lipid measured in each stress treatment. Both white and black bars start at the x axis. The smaller of the white and black bars is “in front” of the other bar. Increments on the vertical scales of A and B (below break) and C are the same; so are those on the vertical scales of D and E (below break). P < 0.05 (n = 5).

