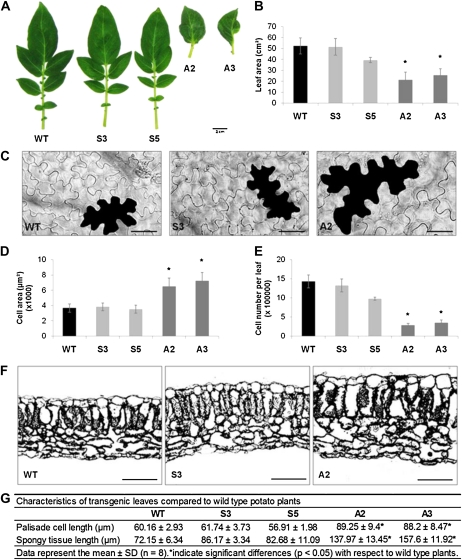
Figure 2.
Leaf phenotypic characterization of wild-type and transgenic lines. A, Overall size and shape of fully expanded leaves. Bar = 2 cm. B, Average total area of 10 leaves. C, Representative images of adaxial epidermal cells from wild-type, S3, and A2 plants. Bars = 50 μm. D, Average area of 100 to 150 epidermal cells. E, Estimated total number of epidermal cells per leaf. F, Light micrographs of fully expanded leaf cross-sections. Bars = 100 μm. G, Measurement of palisade cell length and spongy tissue length of leaf cross-sections. Data represent means ± sd. Asterisks indicate significant differences (P < 0.05) with respect to the wild type. WT, Wild type; S3 and S5, SN1-overexpressing lines; A2 and A3, SN1-silenced lines.

