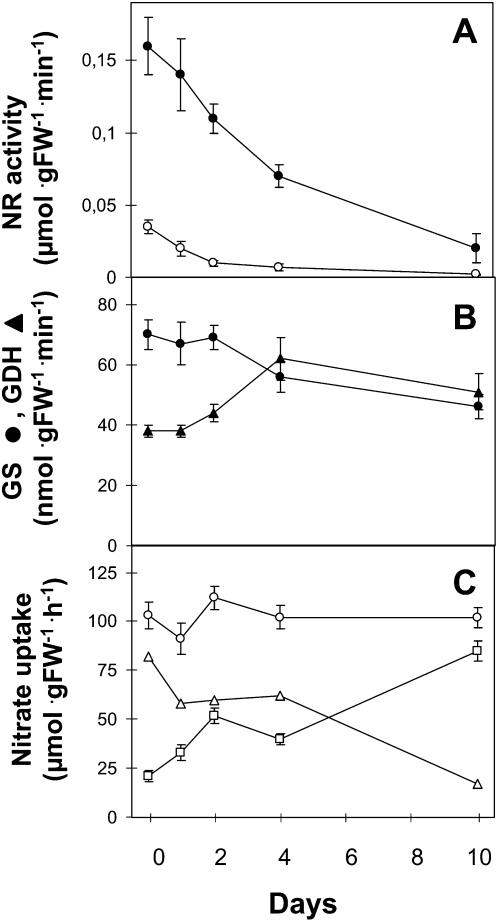
Figure 3.
N assimilation enzymes and nitrate uptake activities during N starvation. A and B, Nitrate reductase (A) and GDH (triangles) and GS (circles; B) were measured in the same plants as described in Figure 1. The values are means ± se of three replicates (pooling three plants for 0, 1, and 2 d). Roots, white circles; shoots, black circles. C, Root 15NO3− influx was measured after a 5-min labeling with a complete nutrient solution containing either 0.2 mm (squares) or 6 mm (circles) 15NO3−. Plants were grown as in Figure 1. LATS (triangles) was calculated as the uptake at 6 mm minus the uptake at 0.2 mm. The values are means ± se of five replicates. FW, Fresh weight.

