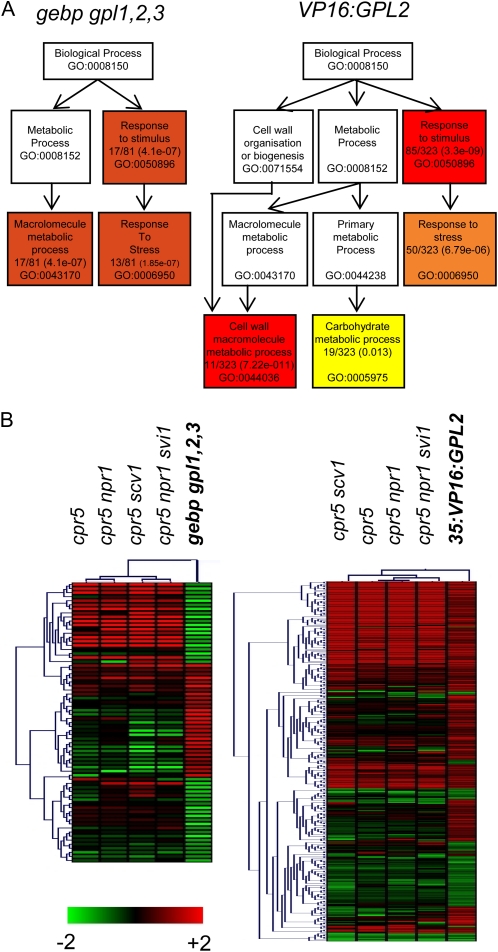
Figure 1.
Gene ontology of gebp gpl1,2,3 and VP16:GPL2 transcriptomic data and transcriptomic similarities with the cpr5 mutant series. A, Gene ontology of gebp gpl1,2,3 (left) and VP16:GPL2 (right) transcriptomic data. Distribution of gene sets among functional biological pathways using singular enrichment analysis of AgriGO are shown. Colors are as in AgriGO, and only the most significant pathways are shown. The ratio of genes involved in each pathway and P values are indicated within boxes together with the gene ontology accession number. The highest probabilities are for the stimuli/stress response (gebp gpl1,2,3 and VP16:GPL2) and cell wall process (VP16:GPL2) pathways. Several entries were not associated to GO terms. Hence 81 genes instead of 88 were used in this analysis for the gebp gpl1,2,3 data and 323 genes instead of 332 for the VP16:GPL2 data. B, Hierarchical clusterings of genes misregulated in the gebp gpl1,2,3 (left) or VP16:GPL2 (right) and cpr5 mutant series. Graphics were generated using Genevestigator and MultiExperiment viewer software.

