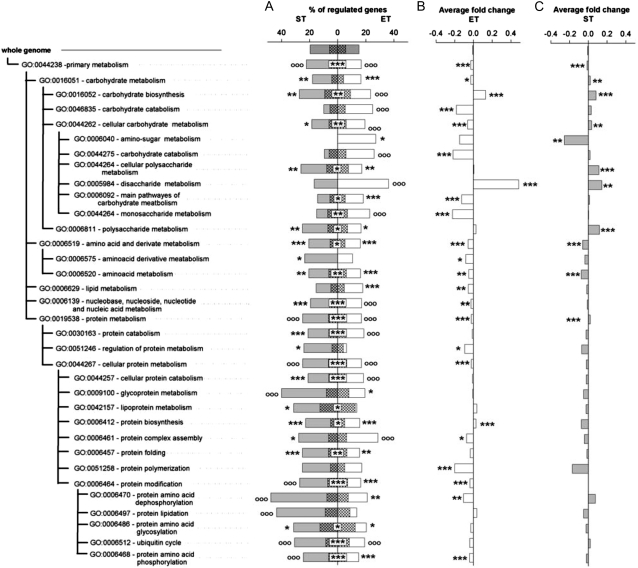
Figure 4.
Transcriptome analysis within the metabolism GO category (GO:0044238). A, Percentage of genes regulated for each GO category. B and C, Average fold changes of expression for all genes in each category for ET (B) and ST (C) treatments. For symbol descriptions, see Figure 3 legend.

