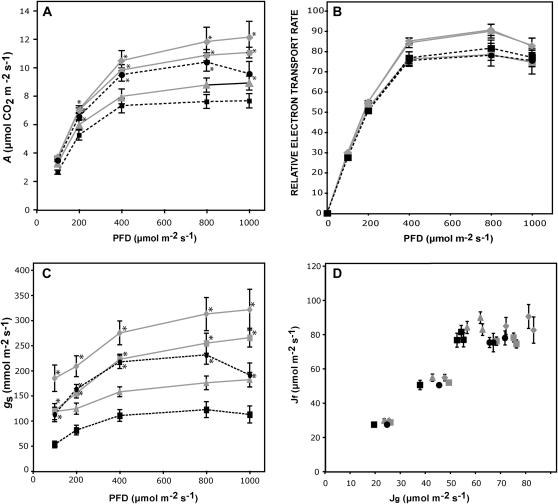
Figure 2.
Effect of SDH deficiency on photosynthesis. A, CO2 assimilation rate at PFDs ranging from 100 to 1,000 μmol m−2 s−1. B, In vivo chlorophyll fluorescence was measured as an indicator of the electron transport rate by use of a LI-COR fluorometer at different light intensities. C, gs as a function of light intensity. D, Electron transport rates determined from fluorescence as in B (Jf) were plotted against electron transport rates calculated from gas exchange (Jg) according to von Caemmerer and Farquhar (1981). Values are presented as means ± se of determinations on six individual plants per genotype. All determinations were performed on fully expanded leaves from 6-week-old plants grown for 2 weeks on plates and 4 weeks in soil. Broken lines, heterozygous SDH1-1/sdh1-1 plants (black circles) are compared with their corresponding Ws wild-type plants (black squares); continuous lines, ih1.1 (gray squares) and ih1.3 (gray diamonds) partially silenced plants are compared with Col0 wild-type plants (gray triangles). In A to C, asterisks indicate values that were determined by t test to be significantly different (P < 0.05) from the wild type.

