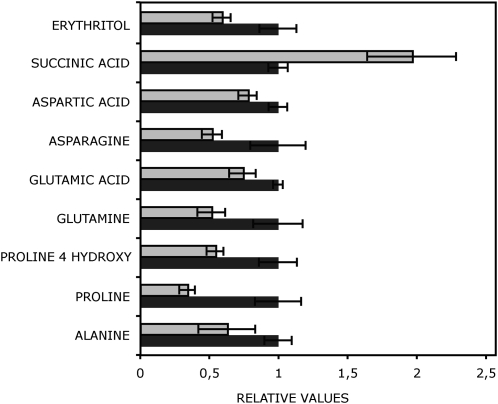
Figure 5.
Relative metabolite content of leaves from 6-week-old SDH1-1/sdh1-1 mutant plants. Data are normalized with respect to the mean response calculated for the wild type. The full data set from this metabolic profiling experiment is available as Supplemental Table S2. Values are presented as means ± se of determinations on six individual plants grown for 2 weeks on plates and then for 4 weeks in soil. The metabolites shown are those for which values in the mutant (gray bars) were determined by t test to be significantly different (P < 0.05) from the wild type (Ws; black bars).

