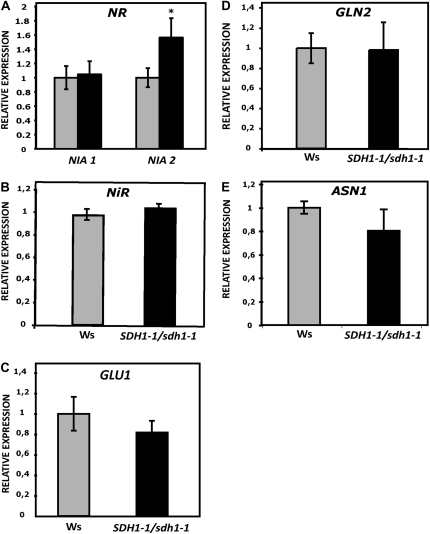
Figure 6.
Expression of genes in the nitrate assimilation pathway. Transcript levels in leaves of 6-week-old plants were determined by qRT-PCR for genes encoding NR (NIA1 and NIA2), NiR, GLN2, ASN1, and Fd-GOGAT1 (GLU1). Expression in mutant plants (black bars) is given relative to wild-type plants (set to 1; gray bars). Values are shown as means ± se from six biological replicates. The asterisk indicates a value that was determined by t test to be significantly different from the wild type (P < 0.05).

