Figure 6.
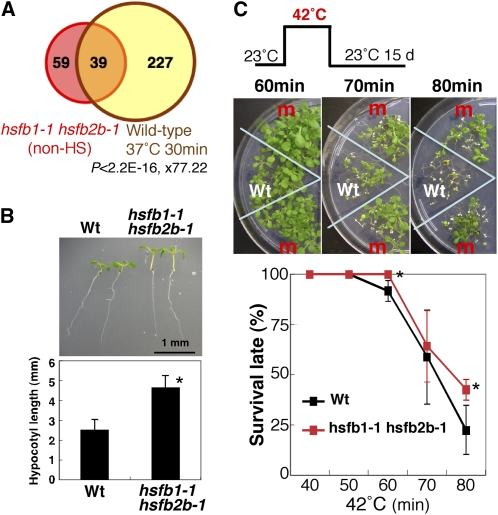
hsfb1-1 hsfb2b-1 plants express the HS-inducible genes under the non-heat condition and exhibit the heat-treated phenotype. A, Venn diagram showing the overlap between genes up-regulated in hsfb1-1 hsfb2b-1 plants at the non-heat condition (23°C; more than 1.5-fold and q < 0.1; pink circle) and those up-regulated in 3-week-old seedlings of wild-type plants treated with 37°C for 30 min (yellow circle). The P value for Fisher’s exact test indicating statistical significance of the overlap and the odds ratio representing the number of overlapping genes/number of genes expected by chance are shown. B, Morphological analysis of hsfb1-1 hsfb2b-1 seedlings under the non-heat condition (23°C). Top panel, 6-d-old seedlings of wild-type (Wt) and hsfb1-1 hsfb2b-1 plants grown at 23°C; bottom panel, length of hypocotyls of 6-d-old seedlings of wild-type and hsfb1-1 hsfb2b-1 plants grown at 23°C. The asterisk indicates a P value below 0.05 between wild-type and hsfb1-1 hsfb2b-1 seedlings. C, Thermotolerance of 5-d-old seedlings of hsfb1-1 hsfb2b-1 plants treated with 42°C. The top panel shows, schematically, the conditions for exposure to HS. The middle panels show wild-type and hsfb1-1 hsfb2b-1 (m) seedlings after exposure to HS for the indicated times. The bottom panel shows survival rates of hsfb1-1 hsfb2b-1 (red line) and wild-type (black line) seedlings. Results are means ± sd (n ≥ 40). Asterisks indicate P values below 0.05 between wild-type and hsfb1-1 hsfb2b-1 seedlings.

