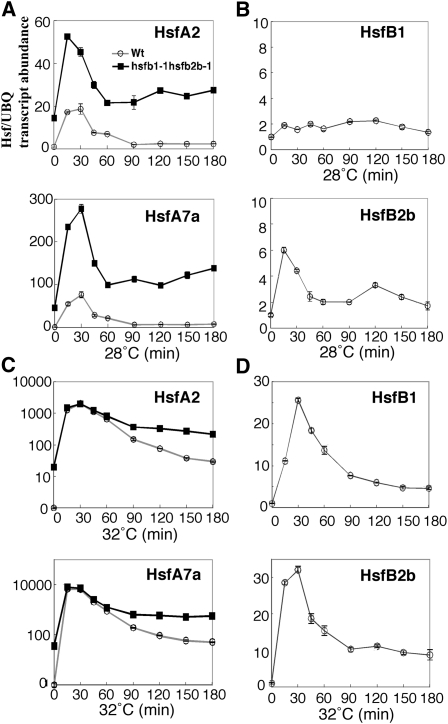
Figure 7.
The relative expression of HsfA2, HsfA7a, HsfB1, and HsfB2b in hsfb1-1 hsfb2b-1 and wild-type (Wt) seedlings under the moderate heat condition (28°C) and in the extended HS period of the HS response (32°C). A and C, Relative expression of HsfA2 (top graph) and HsfA7a (bottom graph) in 5-d-old seedlings of hsfb1-1 hsfb2b-1 (black squares) and the wild type (white circles) during incubation for 3 h at 28°C (A) and 32°C (C). B and D, Relative expression of HsfB1 (top graph) and HsfB2b (bottom graph) in 5-d-old seedlings of the wild type during incubation for 3 h at 28°C (B) and 32°C (D). The level of expression under the normal growth condition (23°C) of wild-type seedlings was taken as 1. The y axis indicates expression relative to an internal control and uses a linear scale in A, B, and D and a log10 scale in C. UBQ, Ubiquitin1.

