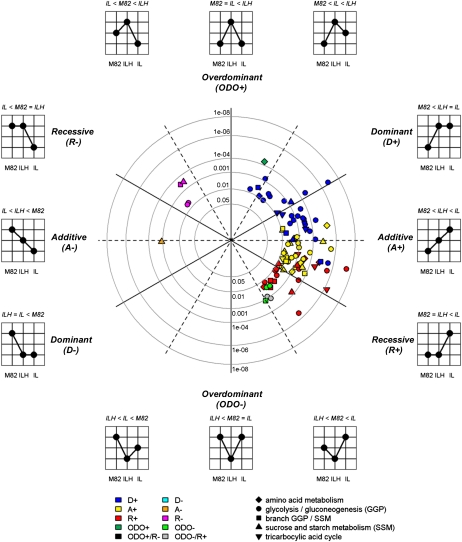
Figure 4.
Two-dimensional polar plot representation of the mode of inheritance and associated P values of detected enzyme activity QTLs estimated using the phenotypic effects in the ILs and ILHs and the parental control M82 based on the 2004 field trial. Traits positioned on the dashed black lines exhibit enzyme activity mean differences of one genotype that are exactly between the genotypes with low and high phenotypic effects. Traits exhibiting clear additive (A) or overdominant (ODO) effects are located on the horizontal and vertical lines, respectively. The distance to the center (radius) reflects the P value associated with a trait estimated using ANOVA of the corresponding homozygote IL data measured for both the 2003 and 2004 trials. The shape of the plotted traits corresponds to the metabolic pathway an enzyme is assigned, as depicted in the key. The color of each shape (see key) corresponds to the mode of inheritance of the trait classified using a decision tree, as suggested by Semel et al. (2006). Only those traits are visualized that were detected and evaluated using both t test analyses of the IL/ILH data from 2004 and ANOVA of IL data from 2003 and 2004 (see “Materials and Methods”; Supplemental Data S3).

