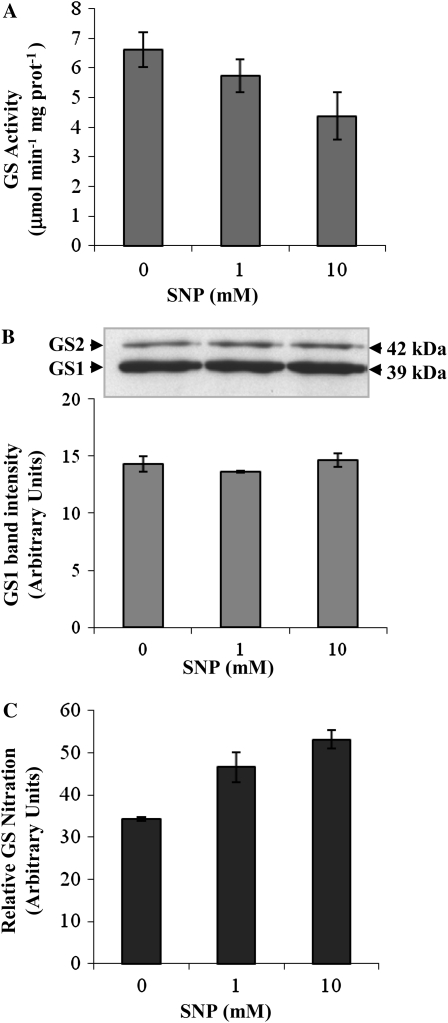
Figure 10.
Evaluation of GS nitration in root nodules treated with SNP. A, Total soluble proteins were extracted from root nodules collected from plants treated with increasing concentrations of SNP. GS activity was measured by the transferase reaction. B, The cytosolic GS (GS1) immunoreactive bands were quantified by densitometry and the values were plotted. A representative GS western blot of total soluble proteins (10 μg per lane) is shown. C, GS nitration was quantified by sandwich ELISA relative to GS1 polypeptide content. Values shown are means of three biological replicates ± sd, assayed in duplicate.

