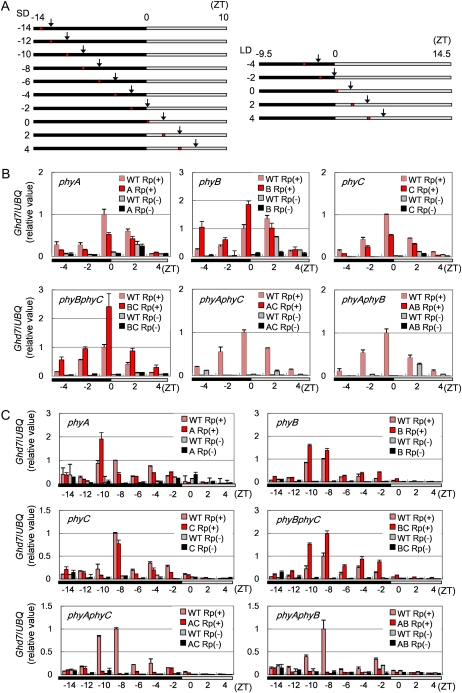
Figure 3.
Ghd7 induction by light signals at distinct phases of the circadian clock. A, Schematic diagrams of light treatments for the expression analysis. After entrainment under SD (right) and LD (left) conditions for 14 d, plants were transferred to continuous dark conditions at dusk. Plants were then exposed to a 10-min red-light pulse, and aboveground plant parts were collected 2 h after irradiation for RNA preparation. Black, gray, and red bars represent dark condition, subjective light condition, and red-light irradiation, respectively. Black arrows show when samples were collected. B to C, Quantitative RT-PCR analysis of Ghd7 mRNA in phytochrome mutants entrained under LD (B) or SD (C) conditions. Values on the x axis of each section correspond to the treatment and sampling patterns in A. The labels A, B, C, BC, AC, and AB in the figure keys indicate phyA, phyB, phyC, phyB phyC, phyA phyC, and phyA phyB, respectively. Rp(+) and Rp(−) indicate treatments with and without red-light pulse, respectively. Bars and error bars indicate average values and sds, respectively, based on three biological repeats. Data are representative of three or more independent experiments.

