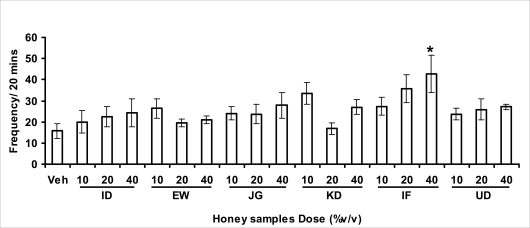
Figure 3.1c.
Effect of oral administration of honey samples on grooming behavior in mice. The graph represents the effects on grooming behavior after administration of honey [ID: Idanre; EW: Ewu; JG: Jigawa; KD: Kaduna; IF: Ife; UD: Umudike] samples (10, 20 or 40%V/v) or vehicle (control). Values are presented as Mean ± S.E.M., (n=5–8). Grooming behavior was increased significantly (F(18, 106)=1.936, p=0.022) by honey sample (IF) when compared with vehicle-treated group (control). *p<0.05 compared with vehicle-treated group.

