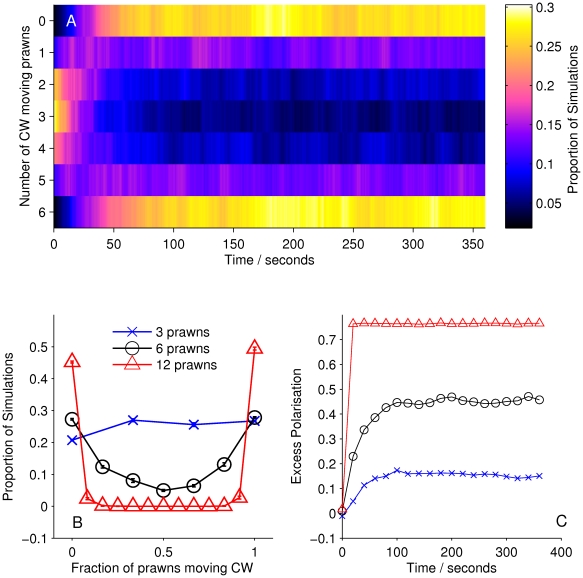
Figure 4. Simulation results for model MF.
(A) Proportion of six-prawn simulations ( ) of mean-field model MF with a given number of prawns moving CW over time. (B) Final distribution of simulations by number of CW moving prawns for simulations with three, six and twelve prawns. Error bars represent the mean and standard deviation for each proportion as calculated from the final ten seconds of the simulations. (C) The average polarisation over time, adjusted by the expected polarisation of randomly oriented prawns, for simulations of three, six and twelve prawns. The KL divergence between the experimental and simulated results is 0.60 bits.

