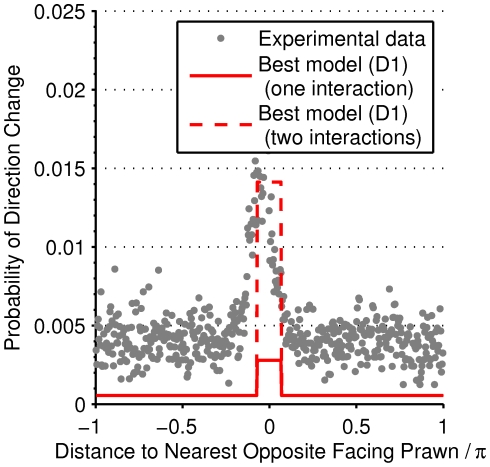
Figure 5. Evidence for short-range interactions.
The empirical frequency of direction changing as a function of the distance to the nearest opposite facing prawn (grey markers) and the probability of changing direction when interacting with one (solid red line) or two (dashed red line) opposite facing prawns according to the optimal model (D1). The empirical data clearly shows the spatially localised interaction, which is confined to within approximately  radians, one-half body length of the average prawn. The model predicts a consistently lower probability of changing direction than the observed frequency when accounting only for instantaneous interactions. This is compensated by the accumulation and persistence of interactions over time.

