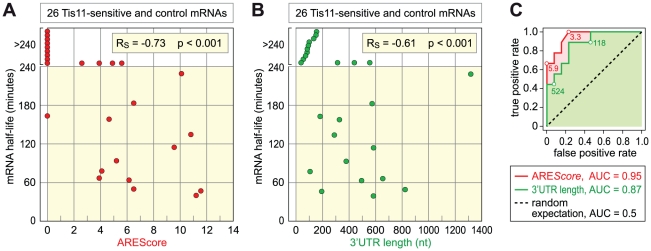
Figure 7. Relationship among AREScore, 3′UTR length, and mRNA half-lives.
(A) The half-lives of 26 Tis11-sensitive and control mRNAs, as measured by qPCR in SL2 cells subjected to control GFP dsRNA, were set in relation to their AREScore. Half-lives above 240 minutes could not be determined accurately, and were presented without scale in the white area at the top of the graph. RS, Spearman rank correlation coefficient. (B) The half-lives of the same mRNAs were compared to their 3′UTR length. Half-lives above 240 minutes could not be determined accurately, and were presented without scale in the white area at the top of the graph. (C) ROC analysis was applied to the 26 mRNAs, testing the ability of both AREScore and 3′UTR length to discriminate mRNAs with a half-life <140 minutes from mRNAs with a half-life >240 minutes. AUC, area under the curve.

