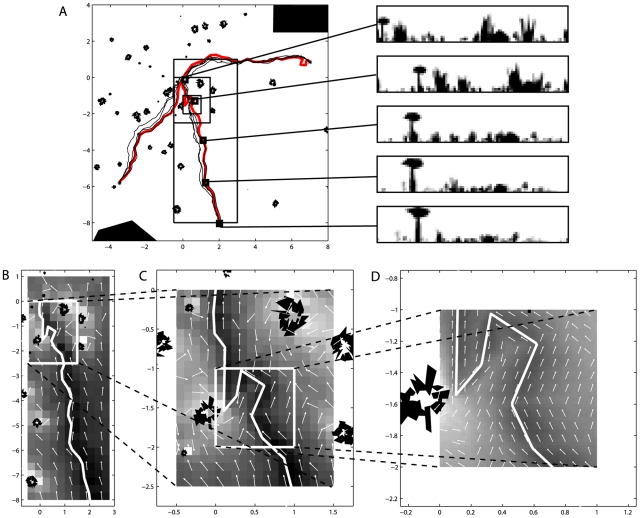
Figure 3. Navigating using a trained artificial neural network to assess scene familiarity.
A) Successful return paths for three different routes. The panels to the right of the main figure show example views from points (indicated by squares) along the training route. B,C,D) Various sections of the middle route at a variety of different scales. The pseudocolour plots indicate the familiarity of the best view as was output from the trained network, with darker hues indicating increased familiarity. Conventions as in Figure 1.

