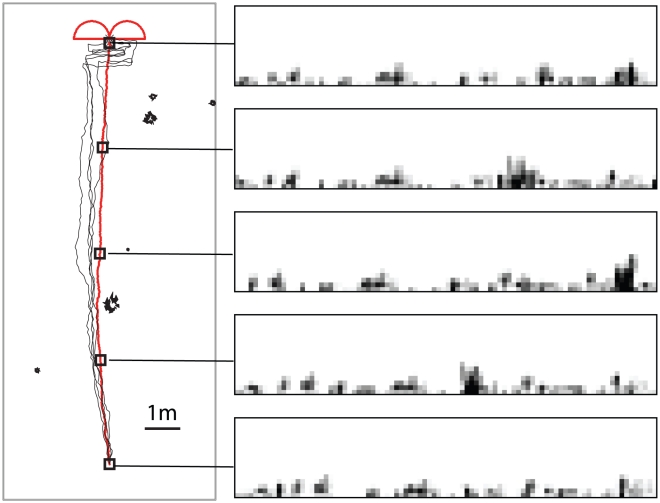
Figure 4. Navigational performance in a sparse environment with a tussock density of 0.05  .
.
The left panel shows the training (red) and test (black) paths for a 12 m route. The right panel shows example views from points (indicated by squares) from the training route. The combined learning walk and training route consisted of 520 views that were used to train the network.

