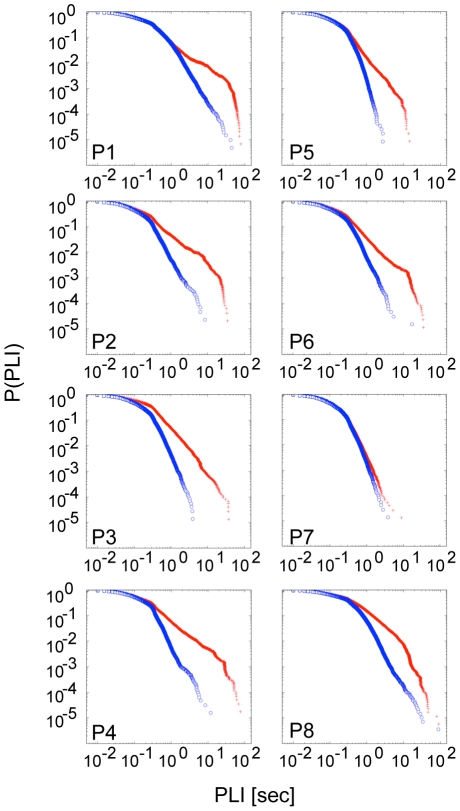
Figure 2. Comparison of PLI distributions derived from the first (pre-ictal) time interval (blue curve) and an interval during the seizure attack (red curve).
Distributions from seizure intervals tend to exhibit longer periods of phase-locking resulting in a deviation from a power-law of the distribution's tail. Plots are shown for scale 3 corresponding to the frequency band 25-12.5 Hz for patients 1–7 (P1–P7) and 32-16 Hz for patient 8 (P8), respectively.

