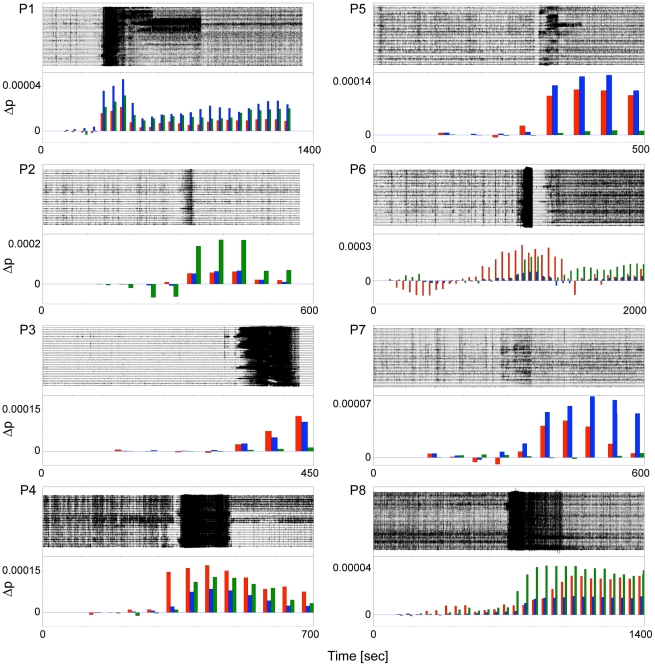
Figure 3. Development of the deviation from a power-law.
ECoG recordings from 8 patients showing a focal seizure attack are shown along with  values for consecutive time windows of 150 seconds duration overlapping by 100 seconds. The power-law fit of data in the first time window was taken as the reference to calculate
  . Although different in extent, an increase of
  quantifying the deviation from the initial pre-ictal distribution can be observed during seizures for all patients and different scales (scale 2 red, scale 3 blue, scale 4 green).

