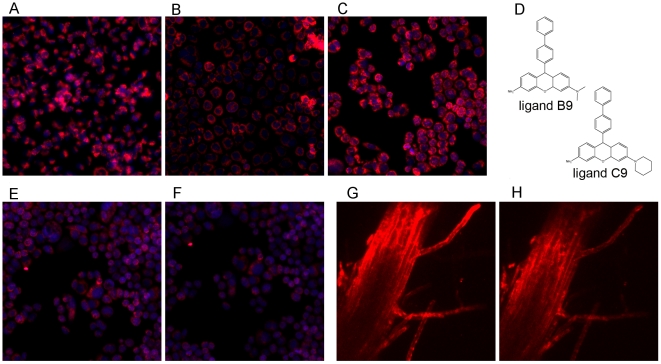
Figure 3. Spatial distribution and non-specific binding signature.
(a–c) An example showing that spatial distribution of compound B9 was heterogeneous for the three mammalian cell lines (a = HS578T, b = Scp2, c = CAMA1 cell lines), (d) structure of B9 and C9, (e–f) images corresponding to in- and out-fluxes for compound C9 in CAMA1 cell line, (g–h) images corresponding to in- and out-fluxes for compound C9 in A. Thailiana root hair.

