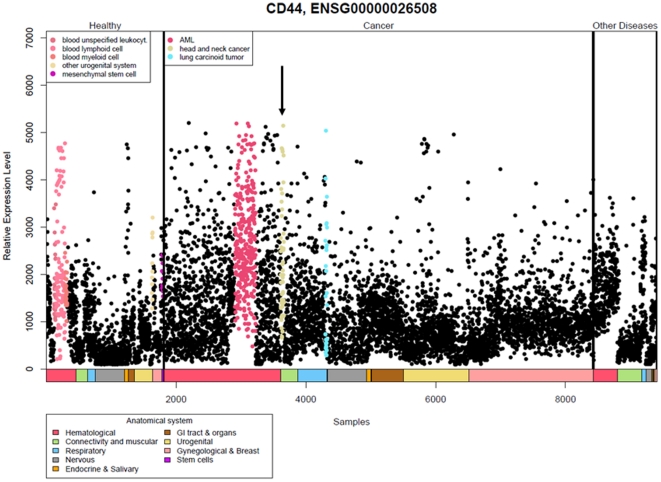
Figure 1. Expression profiles of CD44 from the In Silico Transcriptomics database.
Each sample is represented by a dot and colour coded as in the ‘anatomical systems box’. The samples are divided into three sections; healthy, cancer and other diseases. Samples with higher average expression levels are indicated in colour in the figure, and the corresponding tissues are displayed in the top left of the respective sections, i.e., higher than average expression for CD44 was observed in tumour samples from acute myeloid leukaemia, head and neck cancer (indicated by arrow) and lung carcinoid tumour.

