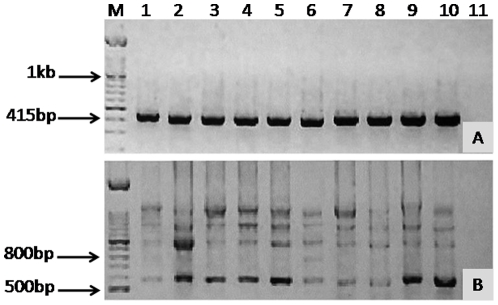
Figure 2. Amplification of β actin and CD44.
RT-PCR was performed, and resolved on a 1.5% agarose gel with a 100 bp ladder. Lanes 1–10 contain NOK, DT, HN4, HN12, HN8, HN22, HN30, HN31, OSC-19, OSC-20. (A), bands at 411 bp are β actin product band. (B), With P1 and P2 primers, bands at 549 bp indicate presence of CD44s RNA in all samples. In addition, NOK and all the other lines produce isoform bands consistent with splicing of variant exons (bands at 1 kb, 1.3 kb, and 1.7 kb). M = 100 bp marker, and Lane 11 water control.

