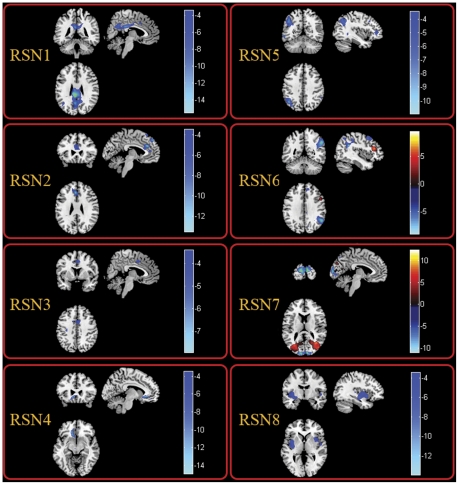
Figure 3. Two-sample t-tests results of the eight RSNs between MPE and HC (P<0.05 corrected by FDR).
The warm and cold colors indicate the brain regions with significantly increased and decreased functional connectivity in MPE compared with HC, respectively. The left side of the image corresponds to the left side of the brain.

