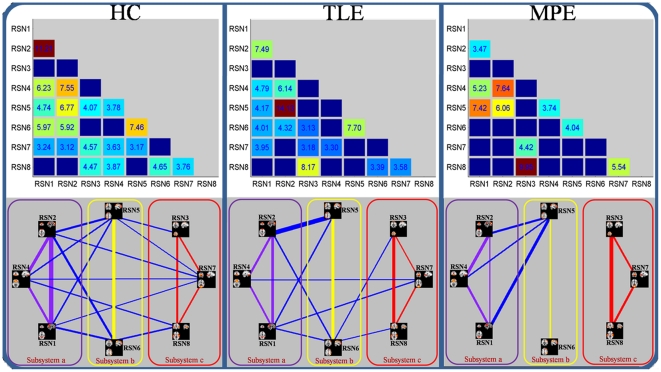
Figure 5. Correlation matrices representing results of FNC analysis for HC (right), TLE (middle) and MPE (left), Significant connections (P<0.05 FDR-corrected) were marked by corresponding T values at upper of figure.
The network map was showed at bottom of figure. Three subsystems: a) these RSNs (in pink rectangle) related to information integration and modulation including the posterior part of the DMN (RSN1), anterior part of the DMN (RSN2) and self-referential network (RSN4); b) these RSNs (in yellow rectangle) related to higher level cognition including the DAN (RSN5,RSN6); c) these RSNs(in red rectangle) related to primary function including the sensorimotor network (RSN3), visual network (RSN7) and auditory network (RSN8). The intensity of the temporal dependency between RSNs was indicated by the thickness of the corresponding line.

