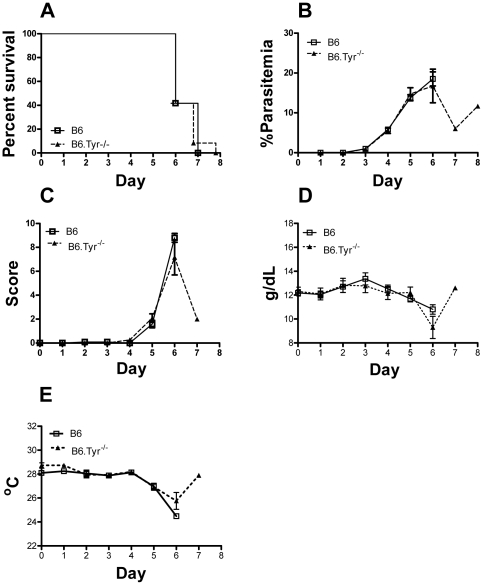
Figure 2. Effect of melanization on cerebral malaria.
(A) The percent of B6.Tyr−/− and B6 P. berghei ANKA infected mice that survived over time is given in Kaplan-Meier curves. Death was defined as a parasitemia ≥60%, moribundity or death (P = 0.71). (B) Parasitemias, determined by GIEMSA stained smears of tail blood, are given for B6.Tyr−/− and B6 infected mice over time. (C) Clinical scores determined by the modified SNAP scoring system are given. (D) Hemoglobin concentrations of B6.Tyr−/− and B6 infected mice are given. (E) Body temperature determined at the tail skin for both B6.Tyr−/− and B6 infected mice over time are given. Data showed represents the mean of 10 animals and bars represent the SEM.

