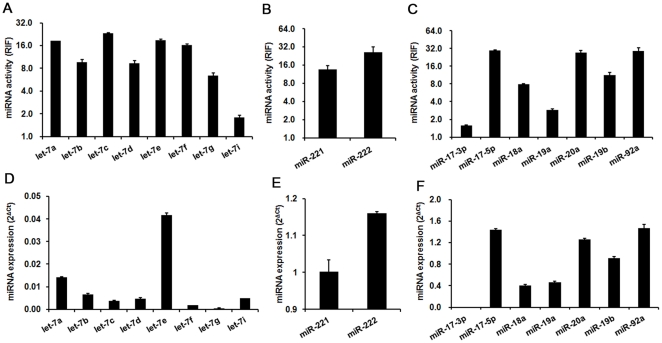
Figure 2. Comparison of miRNA activities with expression levels in HEK293 cells.
(A, D) The activities of members of the let-7 family were not consistent with their expression levels. (B, E) miR-221 and miR222 activities were consistent with their expression levels. (C, F) The consistency of miRNA activity with expression levels was complex in the miR-17-92 cluster. For miR-18a, the miRNA activity was not consistent with its expression level. For miR-17-3p, miR-17-5p, miR-19a, miR-19b, miR-20a and miR-92a, the miRNA activities were consistent with their expression levels. 2ΔCt was used to indicate miRNA expression. ΔCt = CtU6−CtmiRNA. RIF, relative inhibiting fold. Error bars correspond to mean±SD (n = 3).

