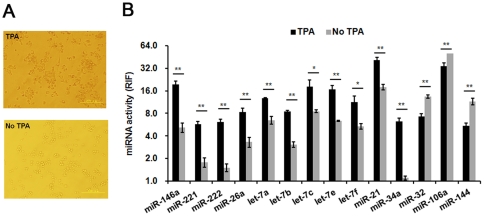
Figure 5. Changes in miRNA activity induced by TPA in K562 cells.
(A) Morphological changes in K562 cells induced by TPA. K562 cells were cultured in DMEM (10% FBS) containing 16 nM TPA. Twenty-four hours later, the morphology of K562 cells was altered. (B) Comparison of miRNA activity induced by TPA versus untreated K562 cells. The miRNA activity profiles with or without TPA were detected using miRNA Asensor arrays and miRNA activities with obvious changes are shown. Error bars correspond to mean±SD (n = 3). Student T test was used for statistical anylasis. * P values<0.05; ** P values<0.01.

