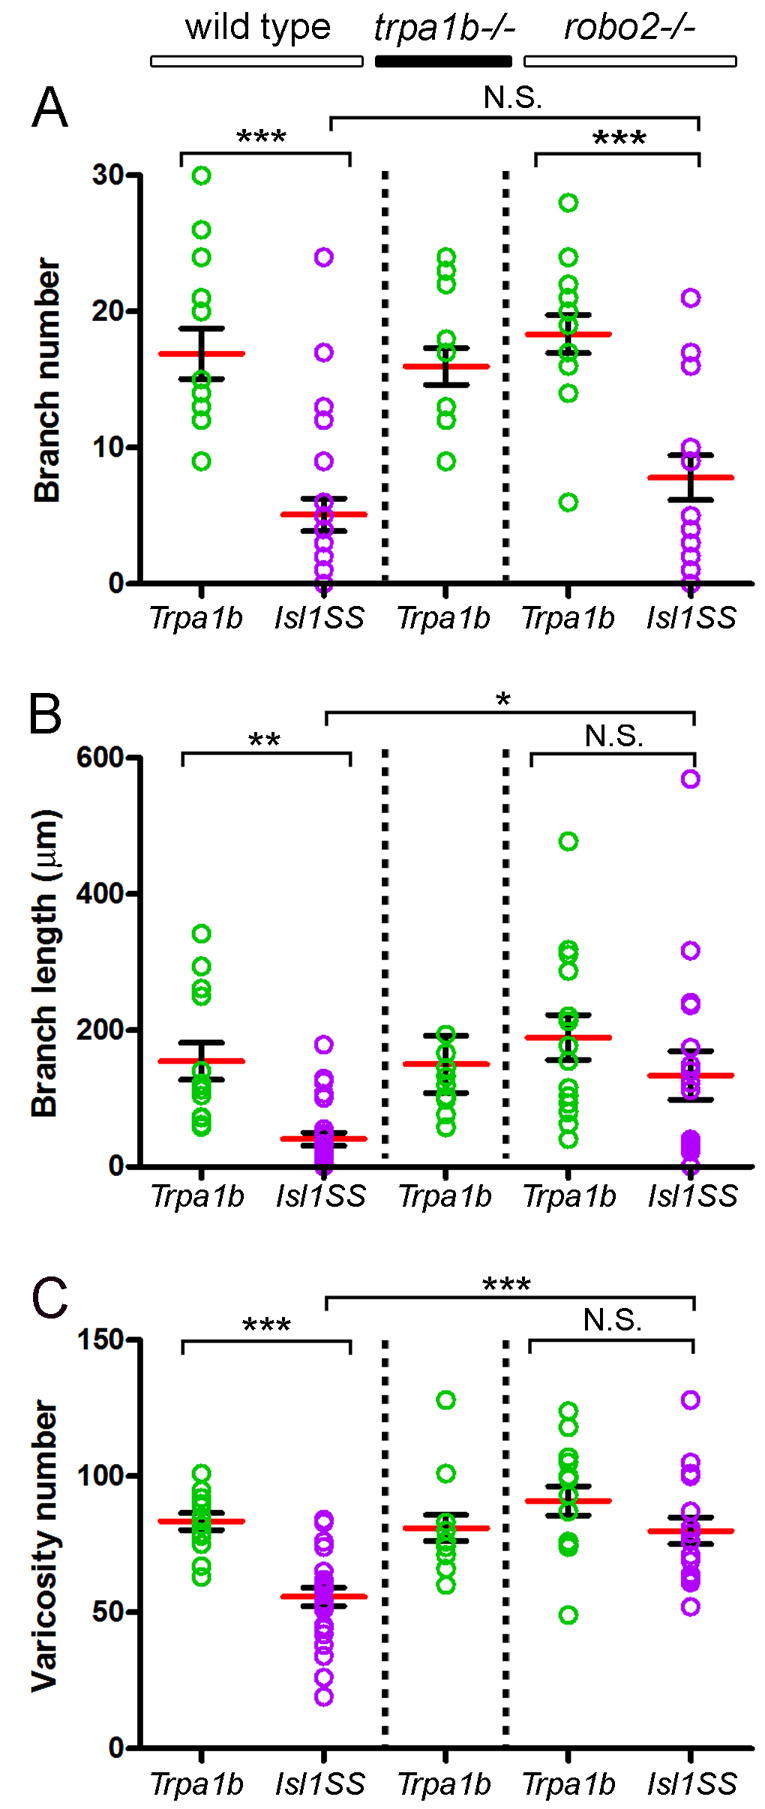
Fig. 3.

Comparison of trigeminal sensory neuron subtype morphologies. Total branch number (A), branch length (B) and varicosity number (C) compared between subtypes and genotypes. Red bar and black bracket are mean and s.e., respectively. Colored circles are values for individual trigeminal sensory neurons. Sample sizes are: 13, Trpa1b in wild type; 25, Isl1SS in wild type; 13, Trpa1b in trpa1b–/–; 14, Trpa1b in robo2–/–; 17, Isl1SS in robo2–/–. *, P<0.05; **, P<0.01; ***, P<0.001; N.S., no significant difference.
