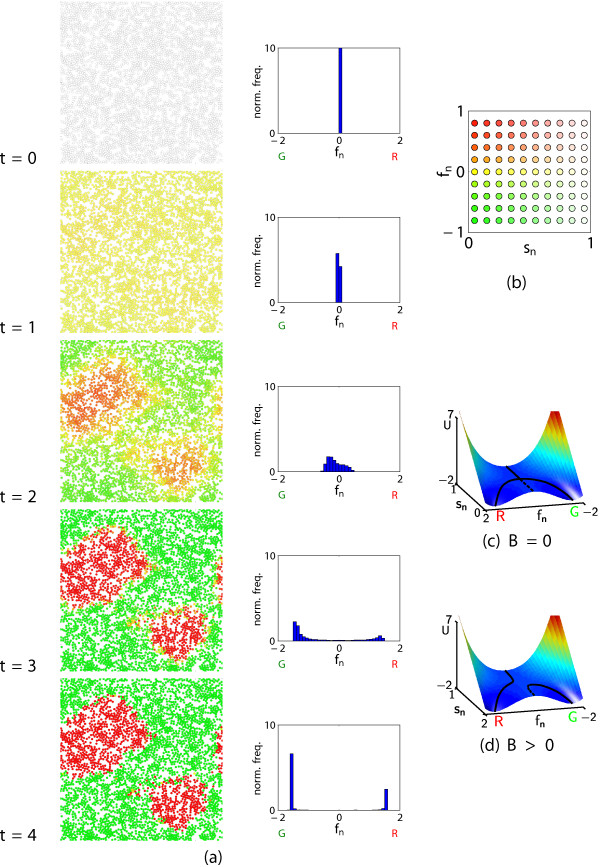
Figure 2.
Temporal development of differentiation patterns. In (a), the left-hand diagrams show the cell states (sn, fn), with cells coloured according to the key in (b); the right-hand diagrams are the corresponding QHs for the distribution of the cell type variable fn. "norm. freq." is normalized frequency. Parameter values: as in Table 1. (c,d) show the potential surface for (2b), for χ = 5, ν = 1 with (c) Bn = 0 and (d) Bn = 0.1. The cells start in a multipotent state (upper valley), but as they progress down the surface they diverge into two distinct phenotypes (lower valleys). Diffusive morphogens bias differentiation towards one of the two states ("tilting" the surface). Solid lines correspond to stable steady-states for the type equation (2b) with sn viewed as a constant parameter.

