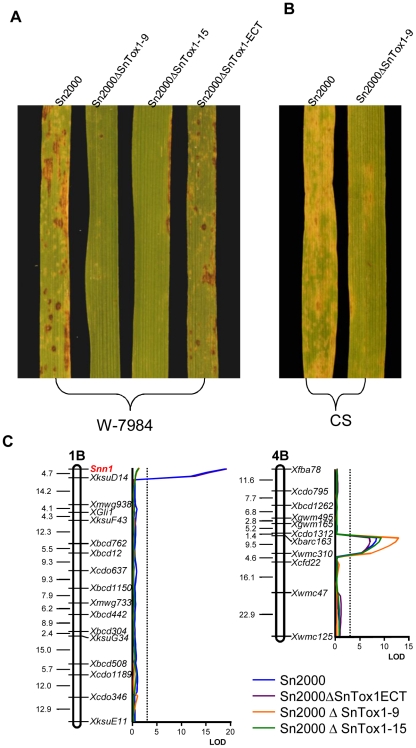
Figure 6. SnTox1 disruption affects virulence only on Snn1 differential lines.
A. Reaction of W-7984 to inoculation with Sn2000 and its SnTox1 disrupted (Sn2000ΔSnTox1-9 and Sn2000ΔSnTox1-15) and ectopic (Sn2000ΔSnTox1-ECT) strains. Compared to the wild type and ectopic strain, the two SnTox1 disrupted strains completely lost virulence on W-7984 which only contains the SnTox1 sensitivity gene (Snn1). B. Reaction of CS to inoculation with Sn2000 and its SnTox1 disrupted strain (Sn2000ΔSnTox1-9). Compared to wild type, the SnTox1 disrupted strain (Sn2000ΔSnTox1-9) showed significantly reduced virulence on CS which is not only sensitive to SnTox1 but to another necrotrophic effector produced by Sn2000. C. Interval map of chromosome 1B (left) and 4B (right) from QTL mapping in the ITMI population inoculated with Sn2000, and its SnTox1 disrupted and ectopic strains. Strains are depicted by different colors as indicated. A centiMorgan scale is on the left of the map and markers are shown in their relative position along the right. The Snn1 locus on the tip of chromosome 1B is shown in red. An LOD scale is shown along the x axis, and the critical LOD threshold of 3.0 is represented by the dotted lines.

